
RA/DEC (2000)
14:57:47.435 +00:21:46.71
224.447647143 +0.362975714286
Type
Varstar
Redshift
Reporting Group
ATLAS
Discovering Data Source
ATLAS
Discovery Date
2018-04-26 11:39:50.000
TNS AT
Y
Public
Y
Discovery Mag
17.329
Filter
orange-ATLAS
Reporter/s
J. Tonry, B. Stalder, L. Denneau, A. Heinze, H. Weiland (IfA, University of Hawaii), A. Rest (STScI), K. W. Smith, S. J. Smartt, D. R. Young, M. Fulton, O. McBrien, D. O'Neill, P. Clark (Queen's University Belfast)
Spectra

▌AT_2018bby - 2021-08-07 06:22:38 FTN / FLOYDS-N (Global SN Project)z=
▌Show H at z=vexp= km/s
▌Show He at z=vexp= km/s
▌Show He II at z=vexp= km/s
▌Show C II at z=vexp= km/s
▌Show C III at z=vexp= km/s
▌Show C IV at z=vexp= km/s
▌Show N II at z=vexp= km/s
▌Show N III at z=vexp= km/s
▌Show N IV at z=vexp= km/s
▌Show N V at z=vexp= km/s
▌Show O at z=vexp= km/s
▌Show [O I] at z=vexp= km/s
▌Show O II at z=vexp= km/s
▌Show [O II] at z=vexp= km/s
▌Show [O III] at z=vexp= km/s
▌Show O V at z=vexp= km/s
▌Show O VI at z=vexp= km/s
▌Show Na at z=vexp= km/s
▌Show Mg at z=vexp= km/s
▌Show Mg II at z=vexp= km/s
▌Show Si II at z=vexp= km/s
▌Show S II at z=vexp= km/s
▌Show Ca II at z=vexp= km/s
▌Show [Ca II] at z=vexp= km/s
▌Show Fe II at z=vexp= km/s
▌Show Fe III at z=vexp= km/s
▌Show Å at z=vexp= km/s
▌Show Å at z=vexp= km/s
▌Show Å at z=vexp= km/s
▌Show Å at z=vexp= km/s
▌Show Tellurics
▌Show Galaxy lines at z=
▌Show WR-WN at z=vexp= km/s
▌Show WR-WC/O at z=vexp= km/s
Binning factor: (rounded to nearest integer >1)
Mouse hovers at WL: 0 (rest),
Light curves
▌ATLAS-HKO_ATLAS-02_orange
Pointer position (MJD, Mag, Abs.Mag): (0.00, 0.00, 0.00)
Spectra
|
|
ID | Obs-date (UT) | Tel / Inst | Exp-Time | Observer/s | Reducer/s | Group | Spectrum ascii file | Spectrum fits file | Spec. Type | Assoc. Groups | End prop. period | Remarks |
|---|---|---|---|---|---|---|---|---|---|---|---|---|---|
|
|
10398 | 2021-08-07 06:22:38 | FTN / FLOYDS-N | 1800 | Las Cumbres Observatory | Megan Newsome | Global SN Project | tns_2018bby_2021-08-07_06-22-38_FTN_FLOYDS-N_Global_SN_Project.ascii | Object | ||||
Light Curves
AT Reports
| ID | Time received (UT) | Sender | Reporter/s | Reporting group | Disc. Data Source | RA | DEC | Discovery date (UT) | Discovery Mag. | Filter | Related files | AT Type | Host name | Internal name | Assoc. Groups | End prop. period | Remarks | ADS Bibcode | Unreal | Auto classification |
|---|---|---|---|---|---|---|---|---|---|---|---|---|---|---|---|---|---|---|---|---|
| 18057 | 2018-04-26 20:25:02 | ATLAS_Bot1 | J. Tonry, B. Stalder, L. Denneau et al. | ATLAS | ATLAS | 14:57:47.435 | +00:21:46.71 | 2018-04-26 11:39:50.000 | 17.329 | orange-ATLAS | PSN | ATLAS18nuj | ATLAS | 2018TNSTR.551....1T | N |
Classification Reports
| ID | Time received (UT) | Sender | Classifier/s | Group | Classification | Redshift | Spectra | Related files | Assoc. Groups | End prop. period | Remarks | ADS Bibcode | |||||||||||||||||||||||||||||||||||||||||||||||||||||||||||||||||||||||||||||||||||||||||||||||||||||||||||||||||||||||||||||||||||||||||||||||||||||||||||||||||||||||||||||||||||||||||||||||||||||||||||||||||||||||||||||||||||||||||||||||||||||||||||||||||||||||||||||||||||||||||||||||||||||||||||||||||||||||||||||||||||||||||||||||||||||||||||||||||||||||||||||||||||||||||||||||||||||||||||||||||||||||||||||||||||||||||||||||||||||||||||||||||||||||||||||||||||||||||||||||||||||||||||||||||||||||||||||||||||||||||||||||||||||||||||||||||||||||||||||||||||||||||||||||||||||||||||||||||||||||||||||||||||||||||||||||||||||||||||||||||||||||||||||||||||||||||||||||||||||||||||||||||||||||||||||||||||||||||||||||||||||||||||||||||||||||||||||||||||||||||||||||||||||||||||||||||||||||||||||||||||||||||||||||||||||||||||||||||||||||||||||||||||||||||||||||||||||||||||||||||||||||||||||||||||||||||||||||||||||||||||||||||||||||||||||||||||||||||||||||||||||||||||||||||||||||||||
|---|---|---|---|---|---|---|---|---|---|---|---|---|---|---|---|---|---|---|---|---|---|---|---|---|---|---|---|---|---|---|---|---|---|---|---|---|---|---|---|---|---|---|---|---|---|---|---|---|---|---|---|---|---|---|---|---|---|---|---|---|---|---|---|---|---|---|---|---|---|---|---|---|---|---|---|---|---|---|---|---|---|---|---|---|---|---|---|---|---|---|---|---|---|---|---|---|---|---|---|---|---|---|---|---|---|---|---|---|---|---|---|---|---|---|---|---|---|---|---|---|---|---|---|---|---|---|---|---|---|---|---|---|---|---|---|---|---|---|---|---|---|---|---|---|---|---|---|---|---|---|---|---|---|---|---|---|---|---|---|---|---|---|---|---|---|---|---|---|---|---|---|---|---|---|---|---|---|---|---|---|---|---|---|---|---|---|---|---|---|---|---|---|---|---|---|---|---|---|---|---|---|---|---|---|---|---|---|---|---|---|---|---|---|---|---|---|---|---|---|---|---|---|---|---|---|---|---|---|---|---|---|---|---|---|---|---|---|---|---|---|---|---|---|---|---|---|---|---|---|---|---|---|---|---|---|---|---|---|---|---|---|---|---|---|---|---|---|---|---|---|---|---|---|---|---|---|---|---|---|---|---|---|---|---|---|---|---|---|---|---|---|---|---|---|---|---|---|---|---|---|---|---|---|---|---|---|---|---|---|---|---|---|---|---|---|---|---|---|---|---|---|---|---|---|---|---|---|---|---|---|---|---|---|---|---|---|---|---|---|---|---|---|---|---|---|---|---|---|---|---|---|---|---|---|---|---|---|---|---|---|---|---|---|---|---|---|---|---|---|---|---|---|---|---|---|---|---|---|---|---|---|---|---|---|---|---|---|---|---|---|---|---|---|---|---|---|---|---|---|---|---|---|---|---|---|---|---|---|---|---|---|---|---|---|---|---|---|---|---|---|---|---|---|---|---|---|---|---|---|---|---|---|---|---|---|---|---|---|---|---|---|---|---|---|---|---|---|---|---|---|---|---|---|---|---|---|---|---|---|---|---|---|---|---|---|---|---|---|---|---|---|---|---|---|---|---|---|---|---|---|---|---|---|---|---|---|---|---|---|---|---|---|---|---|---|---|---|---|---|---|---|---|---|---|---|---|---|---|---|---|---|---|---|---|---|---|---|---|---|---|---|---|---|---|---|---|---|---|---|---|---|---|---|---|---|---|---|---|---|---|---|---|---|---|---|---|---|---|---|---|---|---|---|---|---|---|---|---|---|---|---|---|---|---|---|---|---|---|---|---|---|---|---|---|---|---|---|---|---|---|---|---|---|---|---|---|---|---|---|---|---|---|---|---|---|---|---|---|---|---|---|---|---|---|---|---|---|---|---|---|---|---|---|---|---|---|---|---|---|---|---|---|---|---|---|---|---|---|---|---|---|---|---|---|---|---|---|---|---|---|---|---|---|---|---|---|---|---|---|---|---|---|---|---|---|---|---|---|---|---|---|---|---|---|---|---|---|---|---|---|---|---|---|---|---|---|---|---|---|---|---|---|---|---|---|---|---|---|---|---|---|---|---|---|---|---|---|---|---|---|---|---|---|---|---|---|---|---|---|---|---|---|---|---|---|---|---|---|---|---|---|---|---|---|---|---|---|---|---|---|---|---|---|---|---|---|---|---|---|---|---|---|---|---|---|---|---|---|---|---|---|---|---|---|---|---|---|---|---|---|---|---|---|---|---|---|---|---|---|---|---|---|---|---|---|---|---|---|---|---|---|---|---|---|---|---|---|---|---|---|---|---|---|---|---|---|---|---|---|---|---|---|---|---|---|---|---|---|---|---|---|---|---|---|---|---|---|---|---|---|---|---|---|---|---|---|---|---|---|---|---|---|---|---|---|---|---|---|---|---|---|---|---|---|---|---|---|---|---|---|---|---|---|---|---|---|---|---|---|---|---|---|---|---|---|---|---|---|---|---|---|---|---|---|---|---|---|---|---|---|---|---|---|---|---|---|---|---|---|---|---|---|---|---|---|---|---|---|---|---|---|---|---|---|---|---|---|---|---|---|---|---|---|---|---|---|---|---|---|---|---|---|---|---|---|---|---|---|---|---|---|---|---|---|---|---|---|---|---|---|---|---|---|---|---|---|---|---|---|---|---|---|---|---|---|---|---|---|---|---|---|---|---|---|---|---|---|---|---|---|---|---|---|---|---|---|---|---|---|---|---|---|---|---|---|---|---|---|---|---|---|---|---|---|---|---|---|---|---|
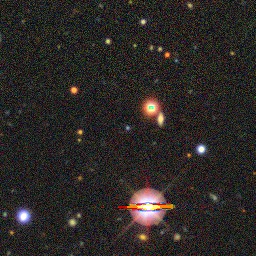
| 10382 | 2021-08-09 17:44:14 | Megan Newsome | Megan Newsome (UCSB/Las Cumbres), Iair Arcavi (TAU), Marco C Lam (TAU), Yael Dgany (TAU), Jamison Burke (LCO/UCSB), Daichi Hiramatsu (LCO/UCSB), D. Andrew Howell (LCO/UCSB), Curtis McCully (LCO/UCSB), Estefania Padilla Gonzalez (LCO/UCSB), Craig Pellegrino (LCO/UCSB) | Global SN Project | Varstar | 1 | Global SN Project | We report a candidate dwarf nova/polar/intermediate nova system (under the transient designations: AT2018bby, ZTF20aammhxq, and ATLAS18nuj) that had outbursts in three occasions with an amplitude of ~6mag. Low-state durations are ~600days. It was reported as a candidate hot white dwarf in Bianchi et al. (2011) with Galex FUV=22.56 and NUV=22.95, and SDSS u=22.53, g=22.98, r=22.88, i=21.85, and z=22.83. The first outburst was reported as a supernova candidate ATLAS18nuj, reaching a maximum brightness of o=17.33 at UT 2018-04-26 11:39:50. The second and third outbursts were observed by ZTF reaching r=16.955 at UT 2020-02-09 12:08:54 and r=17.391 at UT 2021-08-04 05:29:02 at maximum. The spectrum shows weak H-alpha and some He emission lines. From H-beta to H-zeta, there are either emission lines on top of the absorption profiles, or Zeeman splitting features, suggesting a polar or intermediate polar system. | 2021TNSCR2741....1N | ||||||||||||||||||||||||||||||||||||||||||||||||||||||||||||||||||||||||||||||||||||||||||||||||||||||||||||||||||||||||||||||||||||||||||||||||||||||||||||||||||||||||||||||||||||||||||||||||||||||||||||||||||||||||||||||||||||||||||||||||||||||||||||||||||||||||||||||||||||||||||||||||||||||||||||||||||||||||||||||||||||||||||||||||||||||||||||||||||||||||||||||||||||||||||||||||||||||||||||||||||||||||||||||||||||||||||||||||||||||||||||||||||||||||||||||||||||||||||||||||||||||||||||||||||||||||||||||||||||||||||||||||||||||||||||||||||||||||||||||||||||||||||||||||||||||||||||||||||||||||||||||||||||||||||||||||||||||||||||||||||||||||||||||||||||||||||||||||||||||||||||||||||||||||||||||||||||||||||||||||||||||||||||||||||||||||||||||||||||||||||||||||||||||||||||||||||||||||||||||||||||||||||||||||||||||||||||||||||||||||||||||||||||||||||||||||||||||||||||||||||||||||||||||||||||||||||||||||||||||||||||||||||||||||||||||||||||||||||||||||||||||||||||||||||||||||||||||
Spectra
|
|||||||||||||||||||||||||||||||||||||||||||||||||||||||||||||||||||||||||||||||||||||||||||||||||||||||||||||||||||||||||||||||||||||||||||||||||||||||||||||||||||||||||||||||||||||||||||||||||||||||||||||||||||||||||||||||||||||||||||||||||||||||||||||||||||||||||||||||||||||||||||||||||||||||||||||||||||||||||||||||||||||||||||||||||||||||||||||||||||||||||||||||||||||||||||||||||||||||||||||||||||||||||||||||||||||||||||||||||||||||||||||||||||||||||||||||||||||||||||||||||||||||||||||||||||||||||||||||||||||||||||||||||||||||||||||||||||||||||||||||||||||||||||||||||||||||||||||||||||||||||||||||||||||||||||||||||||||||||||||||||||||||||||||||||||||||||||||||||||||||||||||||||||||||||||||||||||||||||||||||||||||||||||||||||||||||||||||||||||||||||||||||||||||||||||||||||||||||||||||||||||||||||||||||||||||||||||||||||||||||||||||||||||||||||||||||||||||||||||||||||||||||||||||||||||||||||||||||||||||||||||||||||||||||||||||||||||||||||||||||||||||||||||||||||||||||||||||||||||||||
Comments